Tag Archives: Value

Elephants…

Spring is busting out all over up here in Lincolnshire, spurred on by the lovely weather recently.  The swallows are back in the barn, always good to see that they made it back from South Africa (where the RSPB tells me British swallows over-winter).  The trees and flowers are all blooming, not quite yet into the Bluebell season yet, but plenty of colour… Lincolnshire Spring 2011

Whilst enjoying the sunshine and in the full flush of the other joys of Spring, one of the topics on my mind recently recently has been Service Integration, an important ingredient for delivering excellent IT services.  The nub of the issue that Service Integration looks to solve is like this:

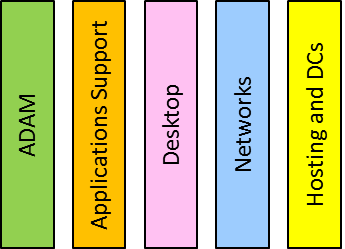
In recent years, the trend for contracting IT Services has been to push beyond the big-bang mega-deals of old to selective outsourcing of like groups of IT services , dubbed “towers” by industry pundits such as Gartner and their ilk, thus:


IT Service Towers

I won’t bore you with the detail here as to why this model doesn’t work that well

However, user services are often a combination of pieces from each tower, so to make users happy, avoid incident “ping-pong” and other good things, services really need to be managed in a joined-up way, orthogonally to the towers, like this

End to end service model

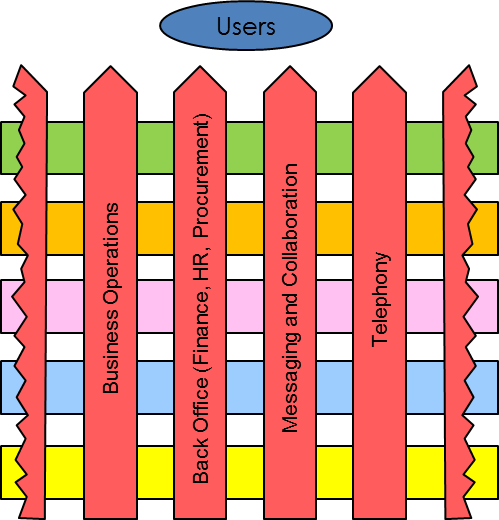
This glues, or integrates, if you like, the different elements of a complete service, hence, this joining-up is “Service Integration”

You could abbreviate Service Integration to SI, but this is ripe for confusion with the older usage of SI, as Systems Integration, all about gluing together bits of software and hardware to make new systems, i.e., Building systems rather Running services.

There have been a number of landmark deals espousing the Service Integration model , from ABN/AMRO and the “Guardian” model back on 2005, through to the most recent state if the art at National Grid with the recently penned deal with HP ( Computing article on National Grid / HP SMI deal and HP Press Release).

One of the usual suspects in building such a model, is dear old ITIL, now ISO/IEC20000

Not to be confused with Tyltyl and Mytyl, characters from Maeterlink’s Blue Bird, a well-known childrens’ classic

ITIL is a worthy model  and has been around for many years since penned by the CCTA, and is now at version 3,. Version 3 is quite good, as it has finally acknowledged that services have a life-cycle, and gosh, this sort of stuff is iterative (what a buzz).  V1 and V2 in contrast had rather static views of the world)

I was astonished recently in one of those rare, but memorable, jaw-dropping, goggle-eyed moments when a sales guy from some other organisation opined in a meeting (to paraphrase) “Why all this fuss about V3, there’s some really good stuff in V2”.  Everybody in the room looked  at the poor unfortunate in deadly silence as he swallowed his foot and half his leg up to the knee and lower thigh, and from that moment he became nobody, a nebbish, a zero.  Ouch!

Nebbish – a Yiddish word meaning “an insignificant, pitiful person; a nonentity”, very effectively characterised in a book I once read but can no longer recall the title so cannot name-check or credit the author (sorry), as a person who when they walk into a room is like someone just walked out

ITIL V3 was published in 2007, but only just really made it into the 21st century with its iterative, nay, agile, flavouring, yet there are a number of “elephants in the room”, major topics not covered that are essential components in the full business architecture of modern IT service delivery…

Elephants in the room

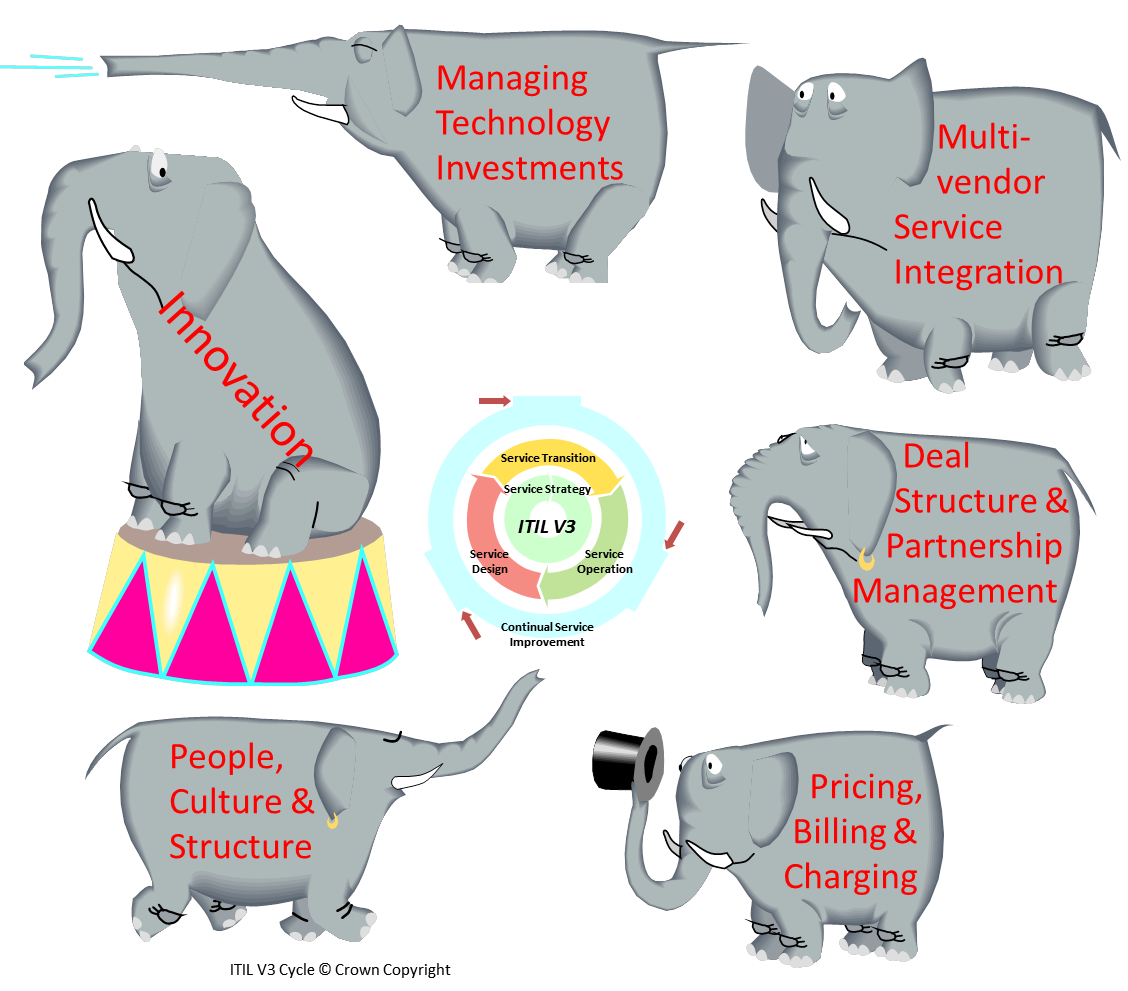
Not just a few elephants, but a thundering herd in fact, in the form of (not exhaustively):

  • Innovation
  • Managing Technology investments
  • Multi-vendor service integration
  • Deal Structure  and Partnership Management
  • Pricing, Billing & Charging
  • People, Culture & Structure (at least 3 elephants, in just this line alone.)

COBIT makes a much broader sweep in its attempt to embrace the whole entity that is a living, breathing IT organisation and seems to fill many of the gaps not covered by ITIL.

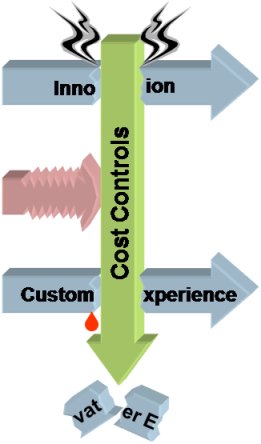
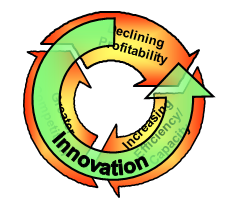
Yes, I know I bang on about Innovation quite a bit in these posts, but it is a common current complaint I hear that innovation has been squeezed out  in deals struck in the 2000s, and now the demand is to find ways to enable it again, even to the extent of considering to pay an Innovation “premium”.

COBIT, founded in GRC, and providing an excellent check-list with which to herd most of the elephants, is as blind as ITIL when it comes to Innovation.  If you search through the text of the COBIT 4.1 framework definition doc, you will find the word “innovation” writ not once at all in its 197 pages!

GRC = Governance, Risk Management & Compliance, in case you wanted to know

Risk management is as central to innovation and agility as it is to the philosophy of COBIT with its focus on control.  Yet there is a classic schism between the COBIT GRC-based shibboleths and the ways of innovation and agility, and one might cynically draw the conclusion that COBIT is about stopping things getting done, whereas innovation and agility are the polar opposite – “skunkworks” innovation is the antithesis of the GRC mindset, even anathema.   And, of course, COBIT is process-oriented, just like ITIL.  Good, but rather 1990s Hammer & Champy and still further to go to get into the 21st century.

The COBIT 4.1 Executive Summary contains a hugely contentious and flawed.headline on page 13 vide “PROCESSES NEED CONTROLS”. To justify this you need to follow this syllogism:

  • Processes are risks
  • Risk need controls
  • Therefore, Processes need controls
    (yes, this is, indeed, nonsense)

This does not compute, the base premise is wrong: Yes, High risks, whether processes or otherwise do need controls, but don’t waste time putting controls on low risk processes.

“Quick, evacuate the building, we’ve had a slightly embarrassing failure to detect a root cause in Problem Management”

Also, processes can be controls, so do we add meta-control processes to control the control processes? – Quis custodiet ipsos custodes ad nauseam.

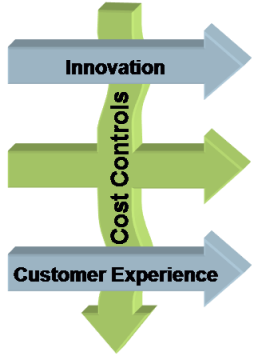
You may think that I am  being rather harsh on the solid works of people who have created ITIL, COBIT et al.  These frameworks are all useful check-lists of best practice, but need to be used with some care, lest the medicine kill the patient.  And they help with the standardisation of service descriptions when making like-for-like comparison somewhat easier in the sourcing and procurement process.  However, they are inevitably behind the leading edge. for example, getting joined-up in the customer experience dimension (orthogonal to both towers and process orientation) is yet another step to go.

On the other hand, getting up the curve to build Innovation into modern IT service deals, well, that can be done right now (give me a call!)

Professor Pages and the Productivity Paradox

On a plane flying back from Boston (Mass.), eaten second breakfast of the day, watched a bit of “Where the Wild Things Are”, annoying, fractious kid who needs therapy (or a sharp slap) and a bunch of needy, fractious rather dopey creatures, disappointed, switched it off, didn’t even care to see if he was reconciled with his poor benighted mother, bored, listening to Muse, need a coffee, some battery life in laptop, here goes…

Recently, I was working with a colleague who exclaimed “You’ve got to be a professor to understand that page” when looking at a consulting 2×2.   Indeed there are some great pages in the world that capture some key thoughts or concepts so concisely that they can be expressed just on one page, but need a voice-over to talk through the layers of meaning embedded, maybe like one of those pointillist paintings or a fractal montages that is made up of pictures that are made up of pictures…(but perhaps not a Dali-esque or Picassoid other world view?).

This diagram below (not the one being commented on, I hasten to add), captures the entire eco-system of outsourced application development on both technical & commercial dimensions, ranging from the narrow individual project up to the strategic vendor relationship level
application_development_ecosystem

Very clever, of course, but it really deserves to be supported by 20 following pages to unpeel the layers and break out the key concepts, etc., etc.

(oohh, a quick round of orange juice…)

But it looks like this when you morph it Dali-style…

dali-ecosystem

…but that is just plain silly, of course. (but an excuse to try out the Virtual Plastic Surgery Software, why don’t you give it a go on one of your favourite photos, and make your self look like your favourite film star, or the Bride of Wildenstein…)

Battery dying….break to watch X-Men Origins: Wolverine, just another load of shouting and uber-angst


Down on the ground now…

However, there are some charts that are very easy to understand, but they do convey a message that is counter-intuitive, and so take a while to get your head round.

This chart is a good example

Productivity_Paradox

This shows the output of a model of software development productivity which paradoxically shows that total coding cost falls whilst the developer daily rate increases.  This is, of course, quite counter to the expectations of typical Aggressive Sourcing gigs which tend to focus on bashing down the daily rates.   The Old Wives and proverb writers of yore new about this since the principle of “Pay peanuts and get Monkeys” is well known.

This is what they used to say, but I do wonder if this phrase might be considered racist in these days of off-shoring, say maybe it should now be “Pay Peanuts, get Numpties” or something like that…

The twist in the tail on this analysis is that in the formula P x Q, where P is Daily Rate, and Q is the number of days needed to complete the project, some people (yes, them) are not aware that Q is inversely proportional to P.  This is the essence of the move to Agile development methods, which favours people over process (amongst other things).

Finally, I also offer you the 2×2 I wrote all by myself one day after an afternoon’s presentation by one of my erstwhile colleagues, a quite (self) important and entitled sort of chap who gave a long presentation from which I came out reeling with “Framework overload”, having survived the discourse from the evolution of Sailing Ships to Dell’s policy build to order policy and positive cash to cash resulting…

So I drew this…

Smoke_And_Mirrors (web)

So there you go…

Beware of BS Benchmarks & Krap KPIs

Recently our esteemed Green Knight, Sir Jonathan Porritt was attributed with saying  “Overweight people are ‘damaging the planet'”.  Of course it turns out that he said something like this in about 2007, in fact building on a comment by the then Secretary of State for Health, Alan Johnson.  But somebody else unearthed it again for some typically twisted reason – nothing can be more topical than mixing global warming with a bit of “fatty slapping”.

The hypothesis behind the hype is that fat people use more resources because they eat more food, but why not then include teenage boys (unfillable, as empty fridges around the country can testify), people with very high metabolic rate, and other some such big eaters.  Ah, well, the logic goes that fat people also drive everywhere and so contribute more CO2 than thin people who, of course, walk or cycle everywhere.   Well, maybe it applies in towns, but it is certainly not true in the countryside, so drawing a different intersection in the Venn diagram I am sketching out here in hyperspace, maybe the headline should have read “Teenage boys and country people with very high metabolic rates are ‘damaging the planet”” – not quite so catchy, or right-on, eh?

But, of course, there is a secondary thesis which is that obese people can be “cured”, especially if they all got out of their cars, walked and cycled, and stopped scarfing all the pies, whence their weight would magically drop away and they would join all the normal people in the happy mean.

When you look at whole populations analytically then of course you usually see some sort of distribution (Normal or otherwise) of whatever factor (weight, in this case) that you might be measuring.   So the theory is that by thinning down the fatties, the shape of the distribution will be changed. However, there are flies in this particular ointment, and if you look around you can find suggestions that obesity is actually a structural feature of a/the/any human population, that everybody has got fatter and that you need to treat the population as a whole, not just focus on the upper tail.

All in all, an example of woolly loose thinking gussying up to a political agenda.

BMI  is one of the weapons in the “fatty slapping” armoury, a metric with some very well documented short-comings, yet standard (mis-)guidance would label people like Lawrence Dilaglio, Jonah Lomu & Mel Gibson as over-weight or obese.  Whilst BMI might have some trivial diagnostic uses, some lard-brained, fat-heads try to use it as a decision-making metric, vide ‘Too fat’ to donate bone marrow – the 18-stone 5’10” sports teacher with a technical BMI of 36.1 who was ejected from the National Bone Marrow Register.  To make a proper health assessment, you need to have a more detailed look at structural features, like waist size, percentage of body fat and so on, before pronouncing.

Just pausing a moment to dissect BMI further, it has units of kg/m2 which is not unlike the metric used to define paper thickness.

Many organisations these days used 80gsm printer paper which is more environmentally friendly than the more sumptuous 100 paper of oldAnd even less rich feeling than the 120gsm paper that Tier 1 consultants use to create a table-thumping report – the dollars are in the loudness of the thump.

As Marshall McLuhan told us, the medium is indeed the message, thickness = quality, and just feel that silky china clay high white finish. Oooohhh…

Sorry, started to get rather indented there, must coach self, control tangents…

So a person who has a BMI of, say, yeah, like 25, is like a piece of 25000gsm paper, no really…equally a piece of A4 paper might have a BMI of about 0.08…

BMI_Badness

Thus BMI is a prime example of a benchmark ratio or KPI that is NOT a good basis for making decisions, as it fails to take account of significant structural factors.

This parable provides an important lesson for practitioners in the world of Information Technology Economics, where many a ratio is measured and analysed by pundits including Gartner et al, a classic being “IT Costs as percentage of Revenue”, one of their IT Key Metrics.

It is defined quite simply as:

ITRMetric

If you dig into the typical drivers of the top and bottom parts of this formula as below, say,

MicroEconomic Drivers – Typical Examples
IT Costs Revenue
  • Business configuration, e.g., Channel/Distribution infrastructure
  • Organisation structure (e.g., headcount)
  • IT Governance & Policies (e.g., Group standardisation)
  • IS architecture and legacy (complexity)
  • IT Service definitions and service levels
  • Development methods & productivity
  • Sourcing/procurement strategy & execution
  • Supplier market diversity
  • Market Structure
  • Competitive environment
  • Market share
  • Product design
  • Consumer behaviour
  • Sales & Marketing performance
  • Customer Service (retention)

then you might surmise that it is quite possible that the Revenue numerator has significant elements that are certainly outside the direct control of the IT organisation, and indeed outside the control of the company, whereas the IT Costs are defined largely by the structure of the organisation, its distribution channels, and internal policies and practices.  The top line is also, I conjecture, more volatile than the denominator, and being mostly outside the control of the IT so a very unfair stick to beat the IT donkey with.  So in qualitative logical terms this metric is certainly appears to be a very poor ‘apples and oranges’ comparator.

If you stretch the analysis further, you can ask the question “what does it mean?”  Is the ratio intended to show the importance of IT? or IT leverage/gearing (bang for the buck)?

Well, if it is some level of importance we are trying to assess, then we should analyse the relationship between this benchmark ratio and true measures of business value, such as, Operating Margin.  Looking across a range of industries the curve looks like this:

Correlation...

OK, is is a deliberately silly chart, just to make the point that this is clearly a wobbly relationship.
If you do a linear regression analysis of the relationship between Operating Margin% and the IT Cost/Revenue ratio and a sibling ratio “IT Cost as a %age of Total Operating Costs” (or “Systems Intensity” to its friends), then you get these results for R2

R2

IT Costs as %age of Revenue vs Operating Margin%

0.175

IT Costs as %age of Op. Costs vs Operating Margin%

0.330

What this shows is that there is no particularly significant linear relationship between these two key metrics and Operating Margin, so quantitatively, the ratios do not really tell you anything about how IT costs/investment drive overall business performance at all.

Even within an industry ratio comparisons are fairly meaningless.  For example, in the past UK Banks had an average Systems Intensity around 20%.  If you were to calculate the Systems Intensity for Egg, the Internet bank, at its height, you would come out with a number ranging from about 17% to 25% depending on how you treat the IT cost component of outsourced product processing and some other structural factors.  And I do recall having a conversation with one Investment Bank CIO who declared, “Yes, of course, we do spend 20% of our operating costs on IT, it’s how we set the budget!”

The whole averaging process loses information too.  Look at the four distributions below, they all have the same mean (i.e., average) but are wildly different in shape.

Distributions_with_same_mean

Without further detail on their parameters than just the mean value of the curves,  you cannot make a sensible comparison at all.

So all these ratios give is some rather weak macro illumination of the differing levels of IT spending between industries, like saying to a Bank “Did you know that, on average, Banks spend 7.3 times more on IT than Energy companies” to which the appropriate response is “YEAH, SO WHAT?”…

…Oh, and maybe, some vague diagnostic indication that there may (or may not) be something worth looking at with a more detailed structural review.  So, why not just go straight there, and dig out the real gold!

And so the morals of this story, O, Best Beloved,  are that just because you can divide two numbers, it doesn’t mean that you should, and be prepared to dig into the detail to truly understand how cost and performance could be improved.

Just so.

Fool Us? More Fool you!

I stayed in an bizarre hotel in Kensington last week and was rather struck by the immense length of the central corridor, and odd green-ness of the lights, creating an institutional, Soviet/Stalinist feel to the place, and the sense that you could walk and walk and never find your room…

The_Green_Mile

…which brings me, of course, to carpets of which this place had many, many hectares.

Carpet stores have always seemed to me to be one of the last hangouts of stone-age man, well, stone-age marketing anyway.

Apart of the never-ending sales, and boring adverts, they seem to harbour troglodytes who have not worked out that it might just be better to treat their customers with a little bit of intelligence. The most insulting manifestation of this is the latest wheeze, the “cut, and then cut some more” sale pricing.

Carpetright have a great deal advertised at the moment at the local store…

Carpet_Madness

An interesting aside is that if you go to the Carpetright website and right-click your mouse, instead of the normal menu, you get a big Copyright notice, not obvious what they have to protect so assidiously

50% and then 20% more is, of course, supposed to make us think they are cutting prices by 70%, but, no, by a clever trick of arithmetic it is only 60% (the 20% only applies to something already cut in half).

“Carpet Stupidity” more like…

Beating the Cost Crunch

We’ve all been through it and know how it goes…
((((ringing))))

Welcome to British Tap.  Please listen carefully as the following options have changed,

Subtext: You’ve not called us before so you wouldn’t know that and it makes no difference to you, and all we are doing is wasting your time whilst the call routing system finds somebody who might be able to answer your call

.
Please note that calls may be recorded for training and quality purposes

Subtext: Because we really don’t trust our agents or our customers for that matter and we need to be able to go back and find out what you said and then tell you that you were wrong and that you didn’t say what you know you said.


Please select from the following options.
Please dial 1 to buy a new widget, please dial 2 if you would like u
s to  try and cross-sell you some insurance for the widget you bought from us last week, Please dial 3 to report a fault with your widget


Your call is being held in a queue and will be answered shortly.
Our agents are busy answering other customers calls

Subtext: The people in front of you who are more important than you and were given a better phone number to call.

Your call is being held in a queue and will be answered shortly.
We value your call.and would love to answer it as soon as we can

Subtext: but we have not  staffed our call centre properly and things are getting a bit out of hand because we are operating on the cheap.


Your call is being held in a queue and (click)

(((((ringing)))))))

कॉल करने के लिए धन्यवाद British Tap . मेरा नाम Nigel है . मैं आज की मदद से आप कैसे हो सकता है ?


Eh? Oh? My boiler is leaking.

我很抱歉,您所谓的Whistle的热线电话,我会转移你向锅炉热线。请稍等


Sorry, what did you say?

(((((ringing)))))


Yes, of course, that old cost-cutting gambit of the offshore call-centre.

Indeed, whilst the overseas call centre pendulum has been swinging back  on-shore in the last year or so, now with cost crunch following credit crunch we can expect that trend to reverse somewhat.

Call centres and the customer experience that go with it are not the only things to get crunched when belts are tightened, discretionary project spending is one of the first things to be reduced,with projects either being deferred or cancelled.  Whilst this is a very hand tap to close, by turning off spending on projects willy-nilly, as snuffing boring, run-of-the-mill sustaining projects, genuinely innovative activities also usually get the chop.

Conceptually, the unfettered application of cost-cutting measures looks something like this…

Cost_Cutting_as_a_Force_of_Destruction

… with good stuff getting damaged at the same time as cutting off all the bad, spendthrift behaviours.

In particular, undiscriminating simplistic cost-cutting can be quite short-sighted and have unforeseen effects down the line.  Indeed,  this process of cost-cutting can accelerate an overall competitive cycle of pain…

The_Cycle_of_Pain

…where declining profitability is met by efforts to increase efficiency through cutting costs, implementing new technology or whatever, which drives greater competition, which leads, to, oh dear, declining profitability, ad absurdum.  “The Banking Revolution: Salvation or Slaughter?”>

However, innovation is one of to primary decelerators of this cycle

Innovation_Reversing_the_Cycle_of_Pain

So the conundrum is how to go about reducing costs without killing the good stuff, thus…

Cost_Cutting_Done_Properly

…to take out cost and building competitive advantage through innovation and better customer experience.

The solution generally lies in being more analytical about the cost-cutting process rather than simple “slash and burn”, such as:

  • Careful prioritisation of projects, for example, choosing to favour of genuine innovation efforts over the projects that just sustain the existing business;
  • Taking a system-level view, e.g, over the customer life cycle, and using joined up thinking to ensure that simplistic, functional cost-cutting does not cut across and destroy customer experience, or in the IT software development arena, taking the whole productivity equation into account (rather than focusing solely on daily rates)
  • Keeping a focus on profitability, rather than just the bottom-line, so that the overall financial health of the enterprise is improved

Meanwhile, back to the phone…

(((((ringing)))))
(click)

Благодарим ви за свикване на British Tap бойлер гореща линия. Казвам се Tony. Как мога да ви помогне да днес?


Oh, !$R£W”Q^%$£&^%$£&%$£”%^)*&%)(*^%$%^£!!!!