
Recently our esteemed Green Knight, Sir Jonathan Porritt was attributed with saying “Overweight people are ‘damaging the planet'”. Of course it turns out that he said something like this in about 2007, in fact building on a comment by the then Secretary of State for Health, Alan Johnson. But somebody else unearthed it again for some typically twisted reason – nothing can be more topical than mixing global warming with a bit of “fatty slapping”.
The hypothesis behind the hype is that fat people use more resources because they eat more food, but why not then include teenage boys (unfillable, as empty fridges around the country can testify), people with very high metabolic rate, and other some such big eaters. Ah, well, the logic goes that fat people also drive everywhere and so contribute more CO2 than thin people who, of course, walk or cycle everywhere. Well, maybe it applies in towns, but it is certainly not true in the countryside, so drawing a different intersection in the Venn diagram I am sketching out here in hyperspace, maybe the headline should have read “Teenage boys and country people with very high metabolic rates are ‘damaging the planet”” – not quite so catchy, or right-on, eh?
But, of course, there is a secondary thesis which is that obese people can be “cured”, especially if they all got out of their cars, walked and cycled, and stopped scarfing all the pies, whence their weight would magically drop away and they would join all the normal people in the happy mean.
When you look at whole populations analytically then of course you usually see some sort of distribution (Normal or otherwise) of whatever factor (weight, in this case) that you might be measuring. So the theory is that by thinning down the fatties, the shape of the distribution will be changed. However, there are flies in this particular ointment, and if you look around you can find suggestions that obesity is actually a structural feature of a/the/any human population, that everybody has got fatter and that you need to treat the population as a whole, not just focus on the upper tail.
All in all, an example of woolly loose thinking gussying up to a political agenda.
BMI is one of the weapons in the “fatty slapping” armoury, a metric with some very well documented short-comings, yet standard (mis-)guidance would label people like Lawrence Dilaglio, Jonah Lomu & Mel Gibson as over-weight or obese. Whilst BMI might have some trivial diagnostic uses, some lard-brained, fat-heads try to use it as a decision-making metric, vide ‘Too fat’ to donate bone marrow – the 18-stone 5’10” sports teacher with a technical BMI of 36.1 who was ejected from the National Bone Marrow Register. To make a proper health assessment, you need to have a more detailed look at structural features, like waist size, percentage of body fat and so on, before pronouncing.
Just pausing a moment to dissect BMI further, it has units of kg/m2 which is not unlike the metric used to define paper thickness.
Many organisations these days used 80gsm printer paper which is more environmentally friendly than the more sumptuous 100 paper of oldAnd even less rich feeling than the 120gsm paper that Tier 1 consultants use to create a table-thumping report – the dollars are in the loudness of the thump.
As Marshall McLuhan told us, the medium is indeed the message, thickness = quality, and just feel that silky china clay high white finish. Oooohhh…
Sorry, started to get rather indented there, must coach self, control tangents…
So a person who has a BMI of, say, yeah, like 25, is like a piece of 25000gsm paper, no really…equally a piece of A4 paper might have a BMI of about 0.08…

Thus BMI is a prime example of a benchmark ratio or KPI that is NOT a good basis for making decisions, as it fails to take account of significant structural factors.
This parable provides an important lesson for practitioners in the world of Information Technology Economics, where many a ratio is measured and analysed by pundits including Gartner et al, a classic being “IT Costs as percentage of Revenue”, one of their IT Key Metrics.
It is defined quite simply as:
If you dig into the typical drivers of the top and bottom parts of this formula as below, say,
| MicroEconomic Drivers – Typical Examples | |
| IT Costs | Revenue |
|
|
then you might surmise that it is quite possible that the Revenue numerator has significant elements that are certainly outside the direct control of the IT organisation, and indeed outside the control of the company, whereas the IT Costs are defined largely by the structure of the organisation, its distribution channels, and internal policies and practices. The top line is also, I conjecture, more volatile than the denominator, and being mostly outside the control of the IT so a very unfair stick to beat the IT donkey with. So in qualitative logical terms this metric is certainly appears to be a very poor ‘apples and oranges’ comparator.
If you stretch the analysis further, you can ask the question “what does it mean?” Is the ratio intended to show the importance of IT? or IT leverage/gearing (bang for the buck)?
Well, if it is some level of importance we are trying to assess, then we should analyse the relationship between this benchmark ratio and true measures of business value, such as, Operating Margin. Looking across a range of industries the curve looks like this:
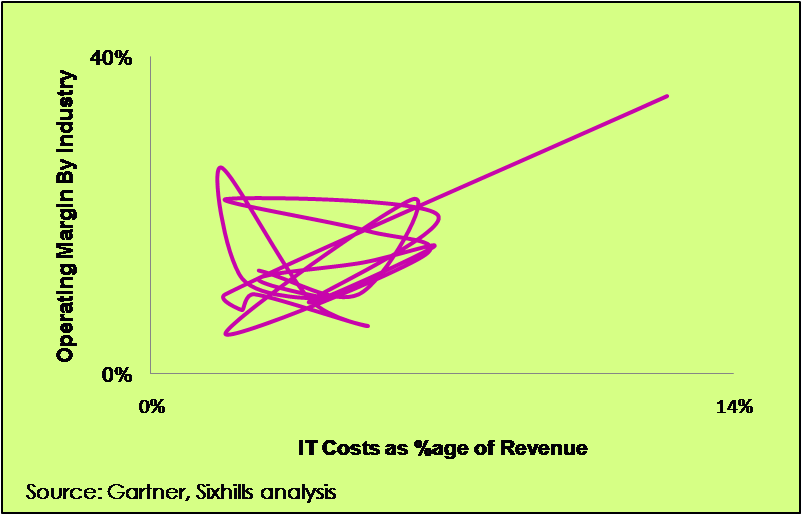
OK, is is a deliberately silly chart, just to make the point that this is clearly a wobbly relationship.
If you do a linear regression analysis of the relationship between Operating Margin% and the IT Cost/Revenue ratio and a sibling ratio “IT Cost as a %age of Total Operating Costs” (or “Systems Intensity” to its friends), then you get these results for R2
|
R2 |
|
|
IT Costs as %age of Revenue vs Operating Margin% |
0.175 |
|
IT Costs as %age of Op. Costs vs Operating Margin% |
0.330 |
What this shows is that there is no particularly significant linear relationship between these two key metrics and Operating Margin, so quantitatively, the ratios do not really tell you anything about how IT costs/investment drive overall business performance at all.
Even within an industry ratio comparisons are fairly meaningless. For example, in the past UK Banks had an average Systems Intensity around 20%. If you were to calculate the Systems Intensity for Egg, the Internet bank, at its height, you would come out with a number ranging from about 17% to 25% depending on how you treat the IT cost component of outsourced product processing and some other structural factors. And I do recall having a conversation with one Investment Bank CIO who declared, “Yes, of course, we do spend 20% of our operating costs on IT, it’s how we set the budget!”
The whole averaging process loses information too. Look at the four distributions below, they all have the same mean (i.e., average) but are wildly different in shape.
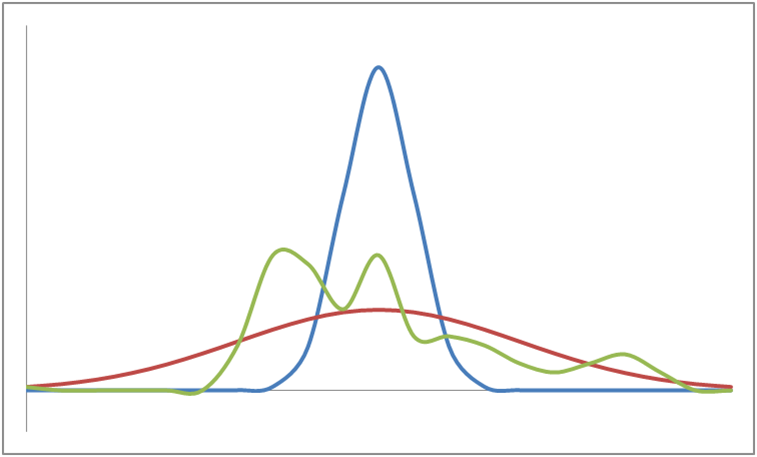
Without further detail on their parameters than just the mean value of the curves, you cannot make a sensible comparison at all.
So all these ratios give is some rather weak macro illumination of the differing levels of IT spending between industries, like saying to a Bank “Did you know that, on average, Banks spend 7.3 times more on IT than Energy companies” to which the appropriate response is “YEAH, SO WHAT?”…
…Oh, and maybe, some vague diagnostic indication that there may (or may not) be something worth looking at with a more detailed structural review. So, why not just go straight there, and dig out the real gold!
And so the morals of this story, O, Best Beloved, are that just because you can divide two numbers, it doesn’t mean that you should, and be prepared to dig into the detail to truly understand how cost and performance could be improved.
Just so.